


GM DOers!
To be a winner in business, tech, or investing it’s important to understand trends.
While we usually uncover the trends of business models and new primitives in the space at Web3 Academy, it’s also important to understand the trends of technological adoption and how it’s valued.
Why? 🤔
Because if you understand the macro trends of blockchain adoption and markets you can properly position your business and finances for the future.
It allows you to proactively hire or fire staff, search for investment at the most opportune times, and prepare your personal and business capital based on where markets are heading.
Without understanding and staying ahead of the trends, you are forced to react, which usually means leaving money and opportunity on the table. 😬
In today's report, I’m going to share the two main trends that drive adoption and, subsequently, the price of a technology. This will allow you to zoom out as a founder or investor and help you make more informed decisions.
And no, this has nothing to do with technical analysis, trading, or specific tokens to invest in. I can’t time the top or bottom or pick the next 100x, nor do I care to.
What I can do however is explain the cyclical nature of technology and crypto and its driving force—and no it’s not the bitcoin halving cycle as this happens in non-crypto prices too. 🤷♀️
I’ll also explain the long-term secular trend of technological adoption, allowing you to position yourself for the long term and make medium-term financial and operational decisions.
Today we aren’t going on-chain…
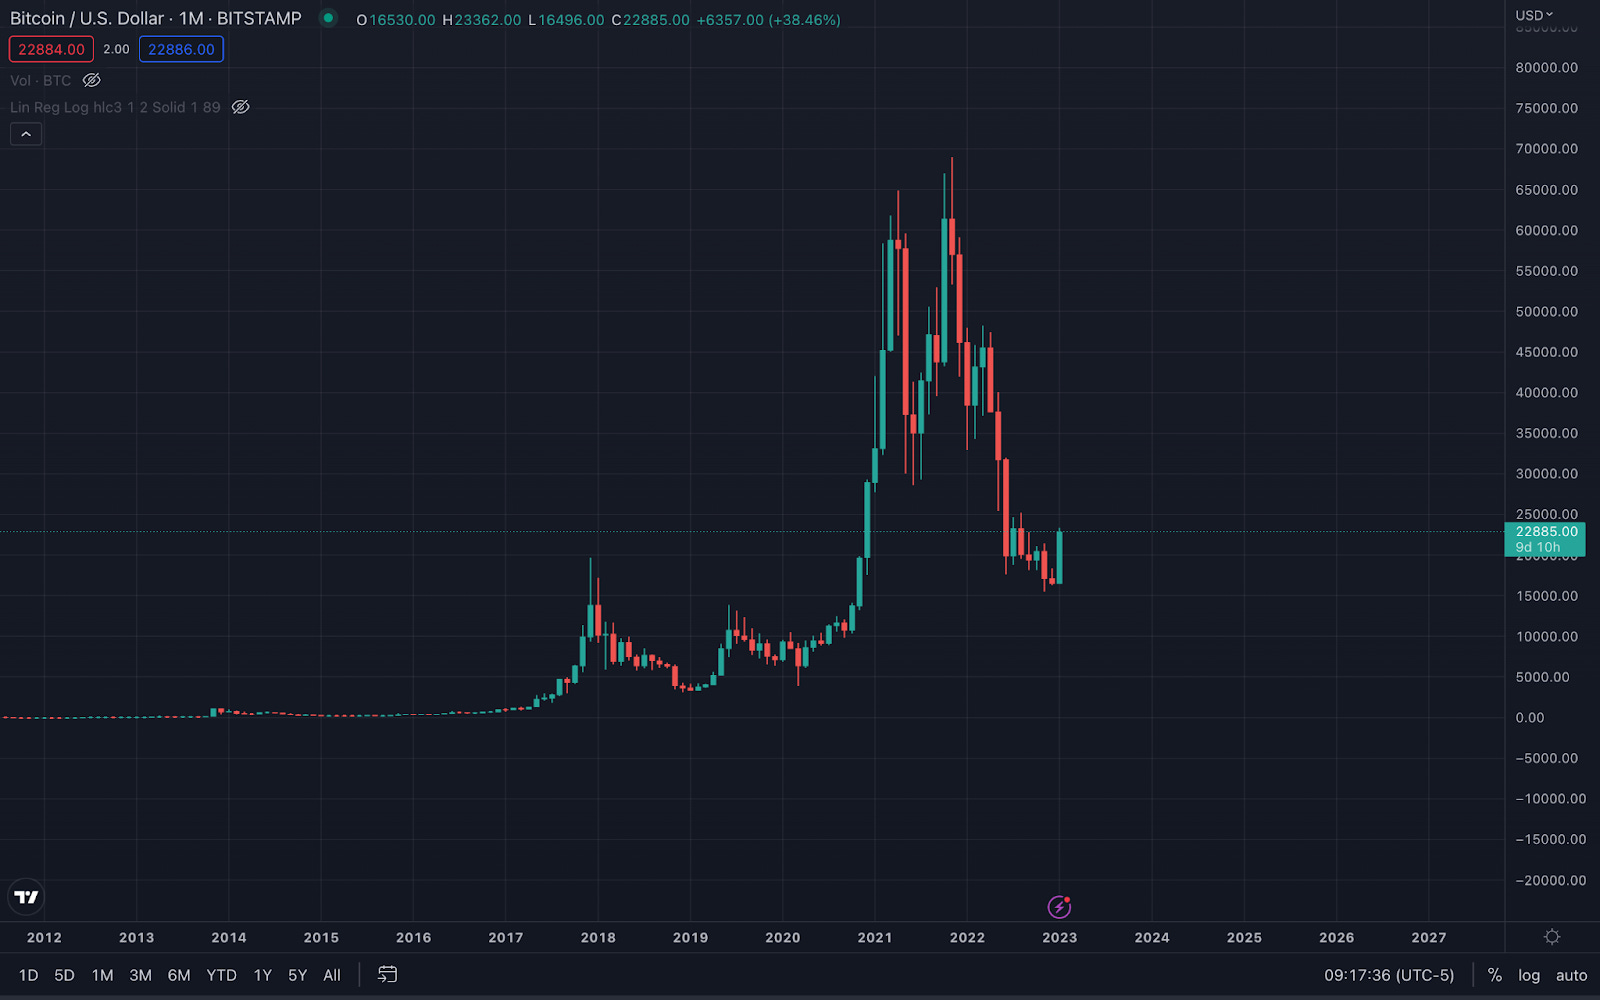
Instead, we’re pulling out our charts. By the way, if you currently look at Bitcoin, Ethereum, or technology stocks on a chart like the one below, then you’re doing it wrong and this report is for you.
Prepare to be in the <1% that truly understands what’s happening in this industry.
But before we dive deep, let us make an announcement. 👀
🟣 PRO PASS AIRDROP COMPLETED
We’re excited to announce that we’ve airdropped the PRO & FOUNDERS Passes to everyone who’s completed the Kazm Form. 🥳
This Pass will now grant you access to the PRO Discord channels (which are now token-gated) and exclusive web3 perks & benefits, such as discounts and whitelists.
We’re striving to provide our PRO members with the best web3 experience possible and the PRO & FOUNDERS Passes will allow us to do so. 🚀
With that said, we don’t want to congest this PRO Report with announcements, so please scroll all the way down to the bottom to find the next action steps.
P.S: You’ll find your 1st perk—a 25% discount on an IRL Web3 Conference that the W3A team will be attending! We may or may not host an exclusive PRO member event during this conference. 👀
Now, let’s get into the difference between secular and cyclical trends. Enjoy 👇
Secular Versus Cyclical Trends
First, let’s understand the difference between secular and cyclical trends.
Secular trends are trends that occur over a long time period (years to decades). In the investing world, they use the term “secular bull run” to describe long-term price increases. 📈
US equities for example have been in a secular bull run for decades. Notice the “number go up” trend in the chart below of the S&P 500 (the top 500 US Equities at the time) since the 1940s.

Of course, the price of US equities has gone up and down plenty over individual years. But in a secular trend, you tend to ignore these blips and instead consider price action over many years to decades.
In technological adoption, you can think of the internet as being in a secular trend since the 90s. The adoption rate goes up and down, but ultimately, it has been nothing but “number go up” over time. ❌
Cyclical trends on the other hand are more short-term and sit within a secular trend. You can think of these as seasonal or following the booms and busts of the business cycle.
More on this later. Right now, let’s dive deeper into understanding the secular trends of technology.
Secular Adoption Trends of Technology
Amazon and Apple, for example, have both been in a secular trend of technological adoption since the 90s. These trends can be attributed to the network effect of their technologies and explained via Metcalfe's Law.
I explained this already in the “Is Solana Dead?” article a few weeks ago, but let’s recap and dive a little deeper.
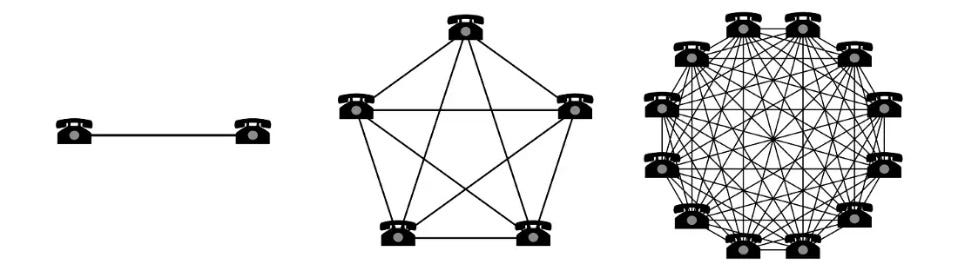
Metcalfe's law states that the value of a network is proportional to the square of the number of connected users in the system.
(Stay with me here… this will all make sense in a few seconds)
In layman's terms, what this means is that for each new person added to a network, the network becomes more valuable.
Each new person added to a network creates a positive feedback loop for more members to be added to the network while also strengthening the connections of the existing members. 💪
If you think about the internet, it became better as more users were onboarded, more websites were created, more businesses started using it and more technologies tapped into it.
Amazon became better as more items were listed on the marketplace and as more items were listed on the marketplace more buyers started using the marketplace, creating a positive flywheel of adoption.
The iPhone became more valuable as more people had iPhones and you could message more people in blue rather than green. 😉
I’m kidding (sort of), but ultimately the App Store became more valuable as more apps were built on it and more users started using those apps.
Amazon and Apple are both technologies that have benefited from Metcalfe’s law and achieved sustained network effects and thus, exponential adoption.
Technologies that achieve exponential adoption in terms of users also typically translate into achieving exponential growth in terms of valuation. 🤝
To be clear, exponential simply means numbers that increase or decrease more and more rapidly over time. As the adoption of these technologies picks up, it becomes faster and faster due to Metcalfe’s Law.
Of course, this does end at some point. But that’s how it begins and grows for a certain period of time during its secular trend.
This brings me to the first key lesson of this report:
Logarithmic Charts > Linear Charts
When valuing technologies with exponential adoption, we must view their values in exponential scales, rather than linear scales.
This means that when you look at a price chart of network-based companies or technologies, it’s better to look at them on a logarithmic scale (1, 2, 4, 8, 16, 32, 64, 128...) rather than the typical linear scale (1, 2, 3, 4, 5, 6, 7, 8…)
Why?
Because the cyclical trends within a technology that enjoys significant network effects are exaggerated and it can alter your perspective on the overall trend of a technology.
These technologies often look like they are in a bubble, resulting in many analysts and investors missing the incredible upside of Amazon’s secular bull run over the last 25 years. 💁♂️
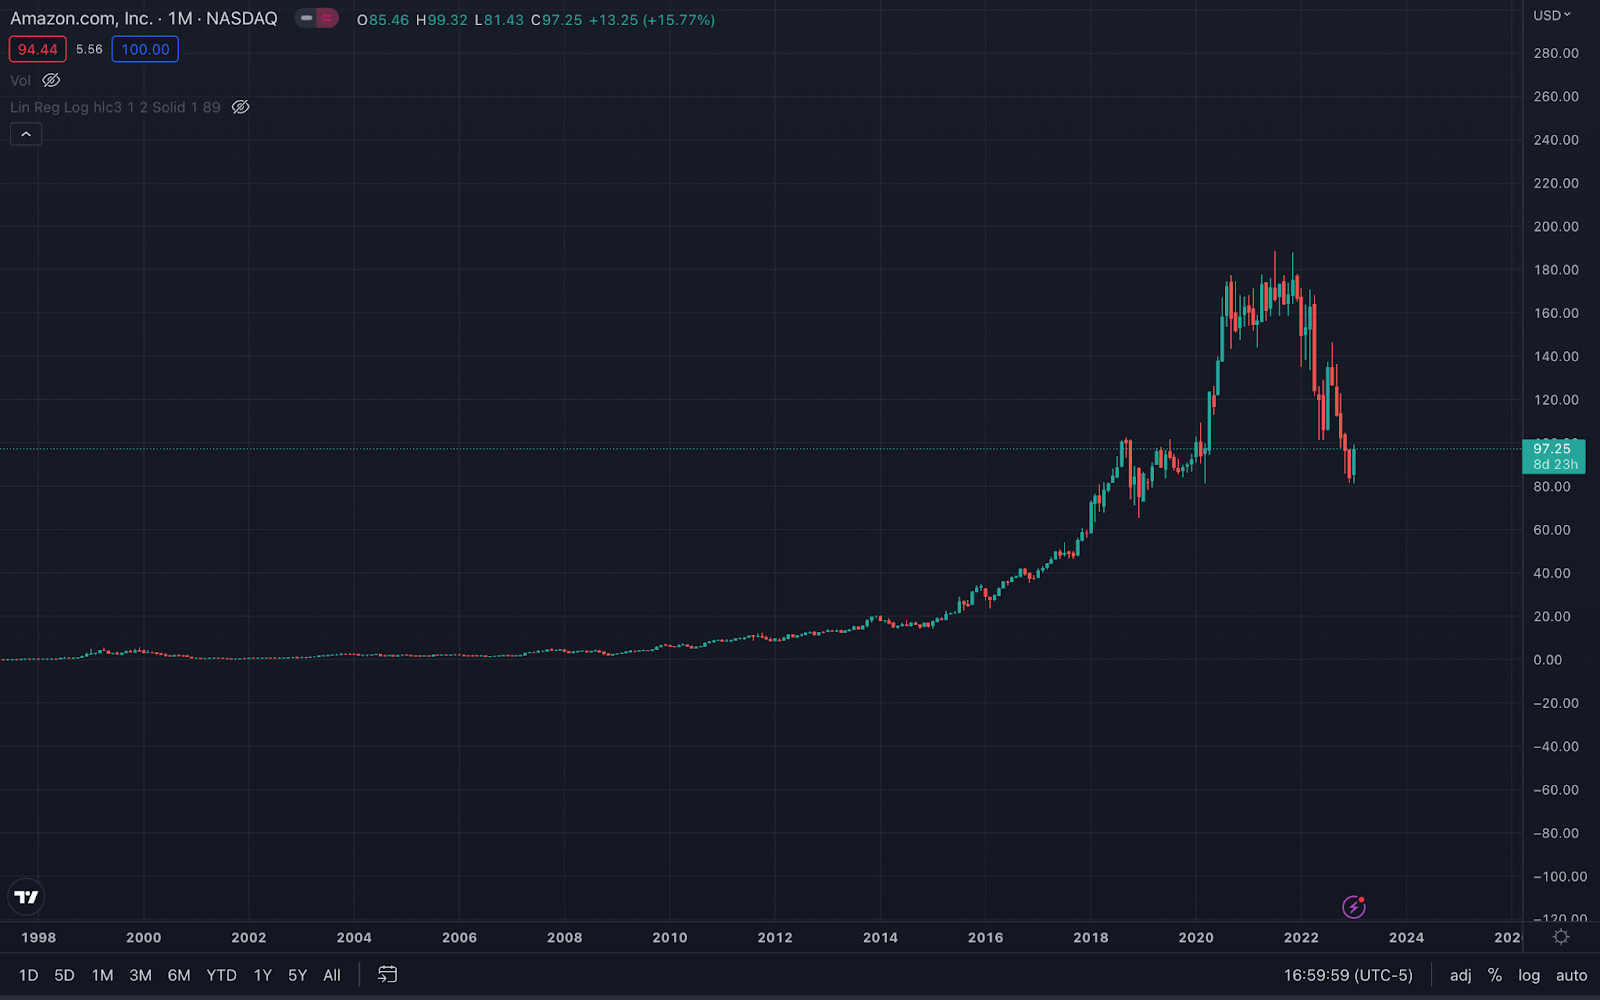
Here is a chart of Amazon on a linear scale since 1997. Did the bubble just pop?
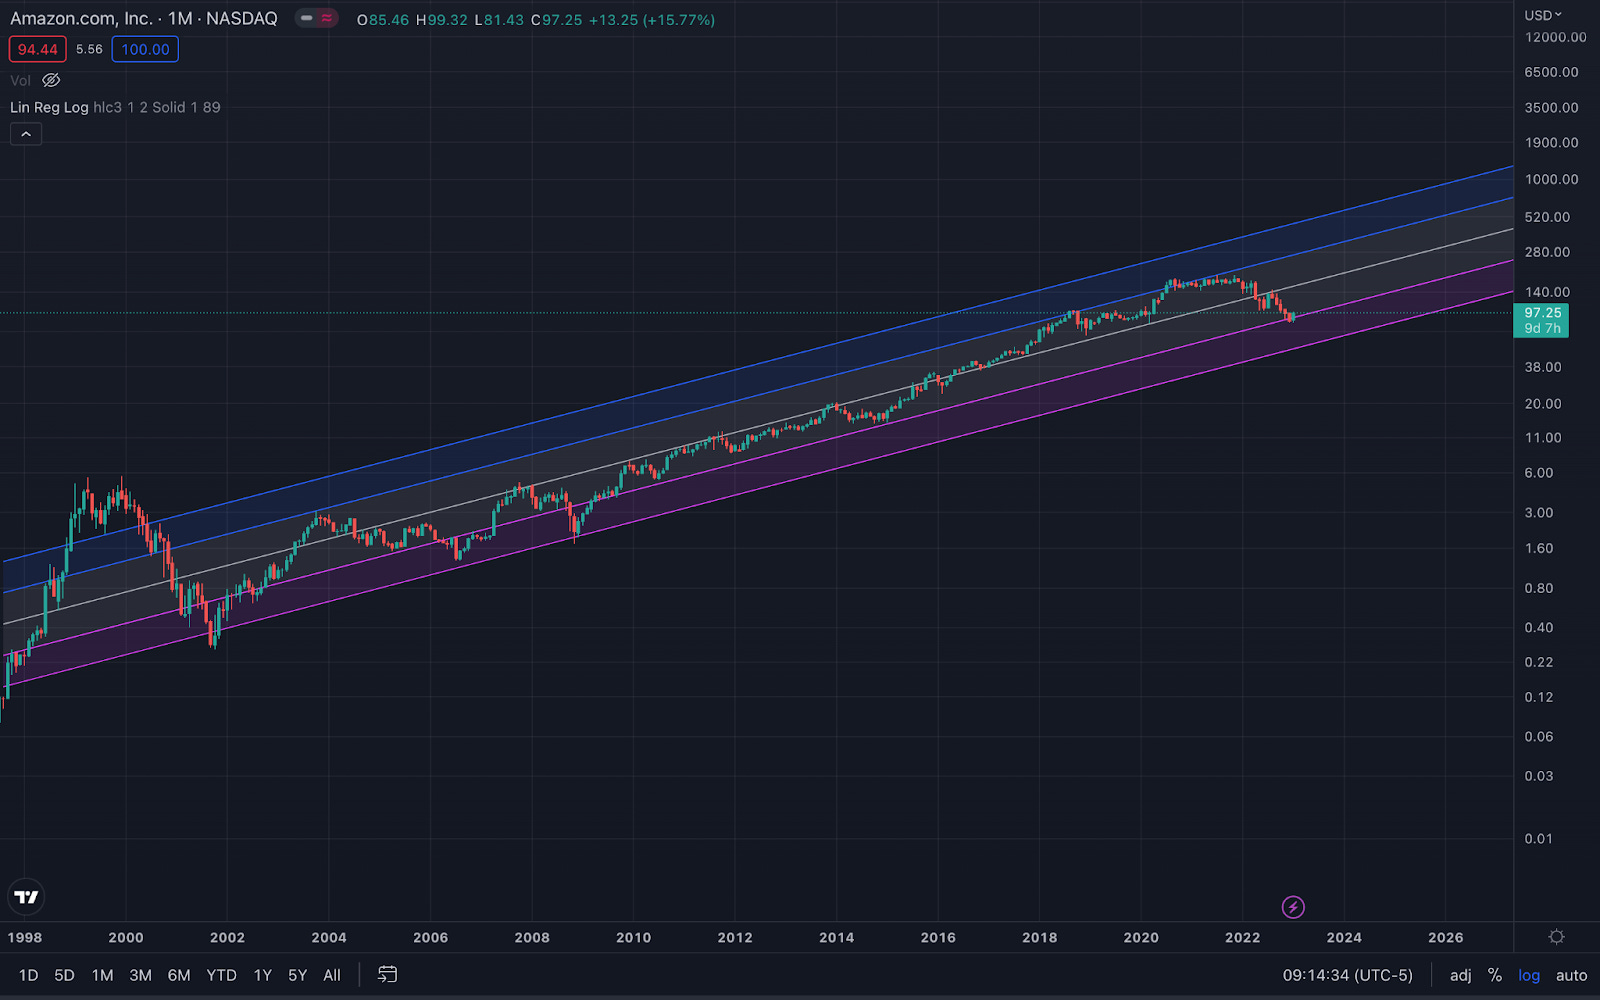
Here is a chart of Amazon on a logarithmic scale since 1997. This “bubble” now looks irrelevant.
The purple, blue, and grey lines are a simple logarithmic regression channel, which is essentially mapping exponential adoption or exponential growth in price based on standard deviations of price.
Note: Each line (other than the middle one) represents a 1 standard deviation excursion from the mean.
Now, below is the same chart of Amazon on a logarithmic scale but each “bubble” like we saw in the linear chart is noted. Amazon was in a “bubble” 6 times and dropped 30% or more.
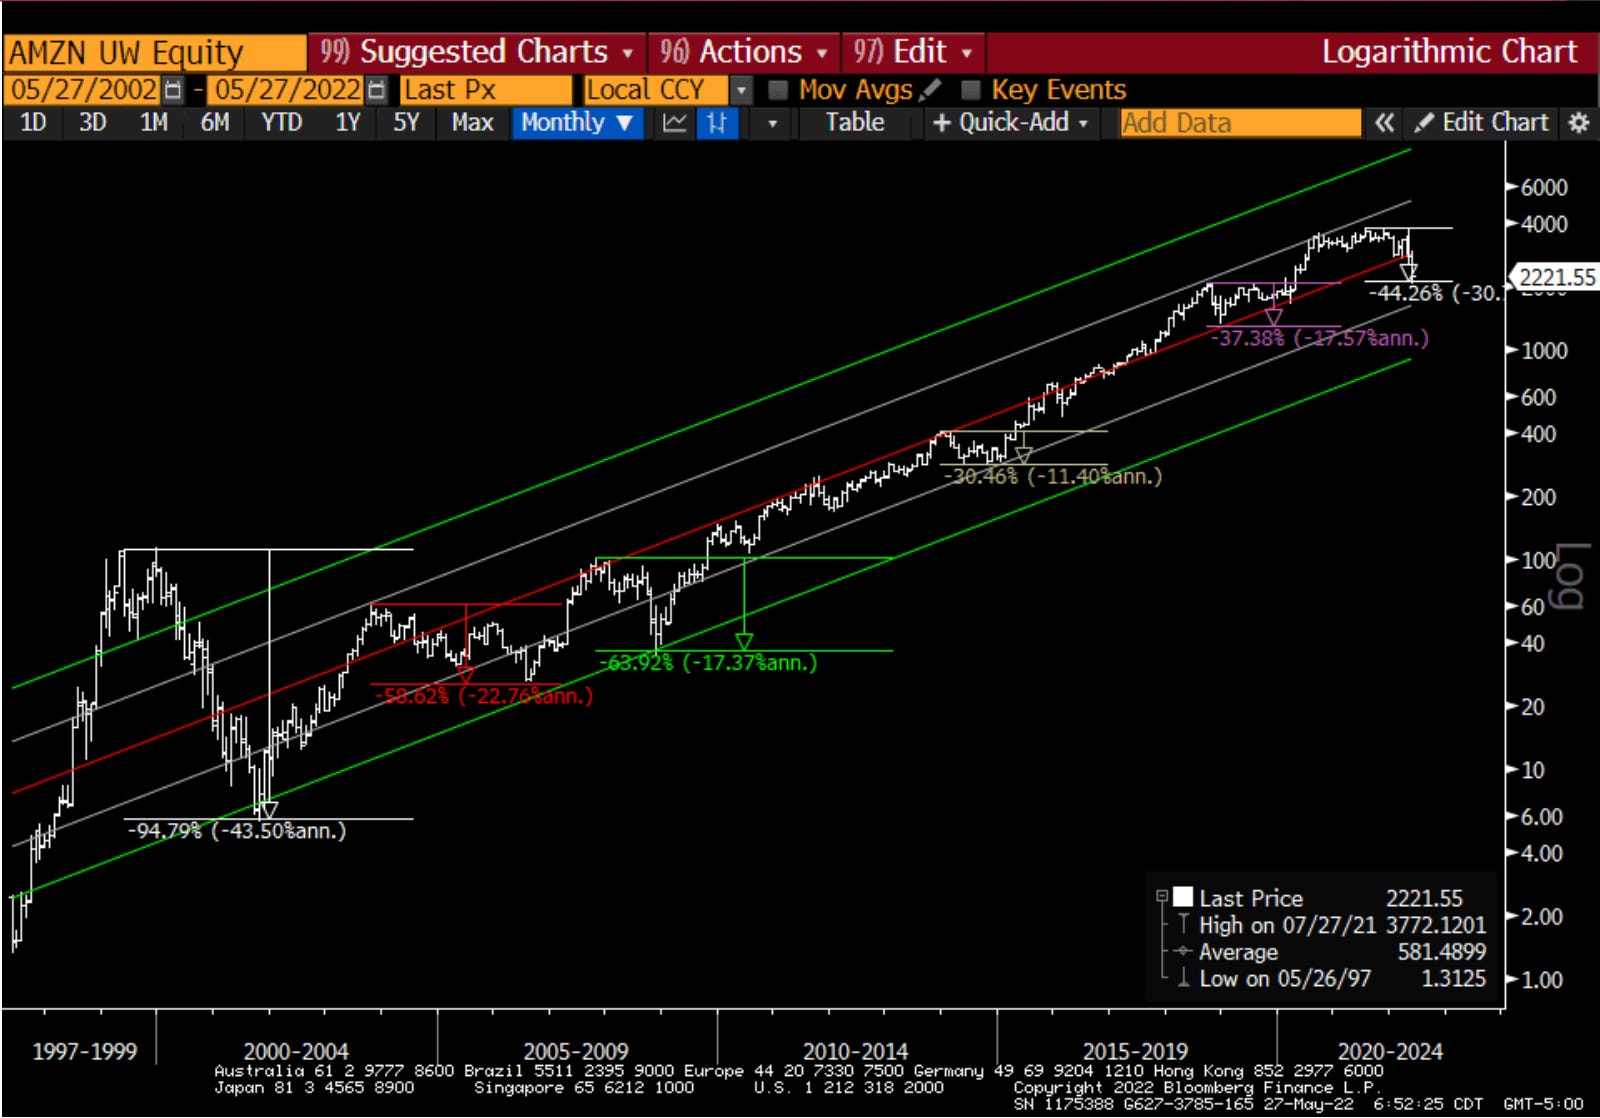
Each time we move 1 or 2 standard deviations below or above the exponential trend line we find our way back, so long as the network isn’t broken.
This can only be seen in a logarithmic chart because Amazon’s growth is exponential, not linear.
Technologies with network effects all grow in a similar pattern, albeit at varying speeds depending on the amount of “participant types” (think end users, application builders, etc.) in the network creating connections.
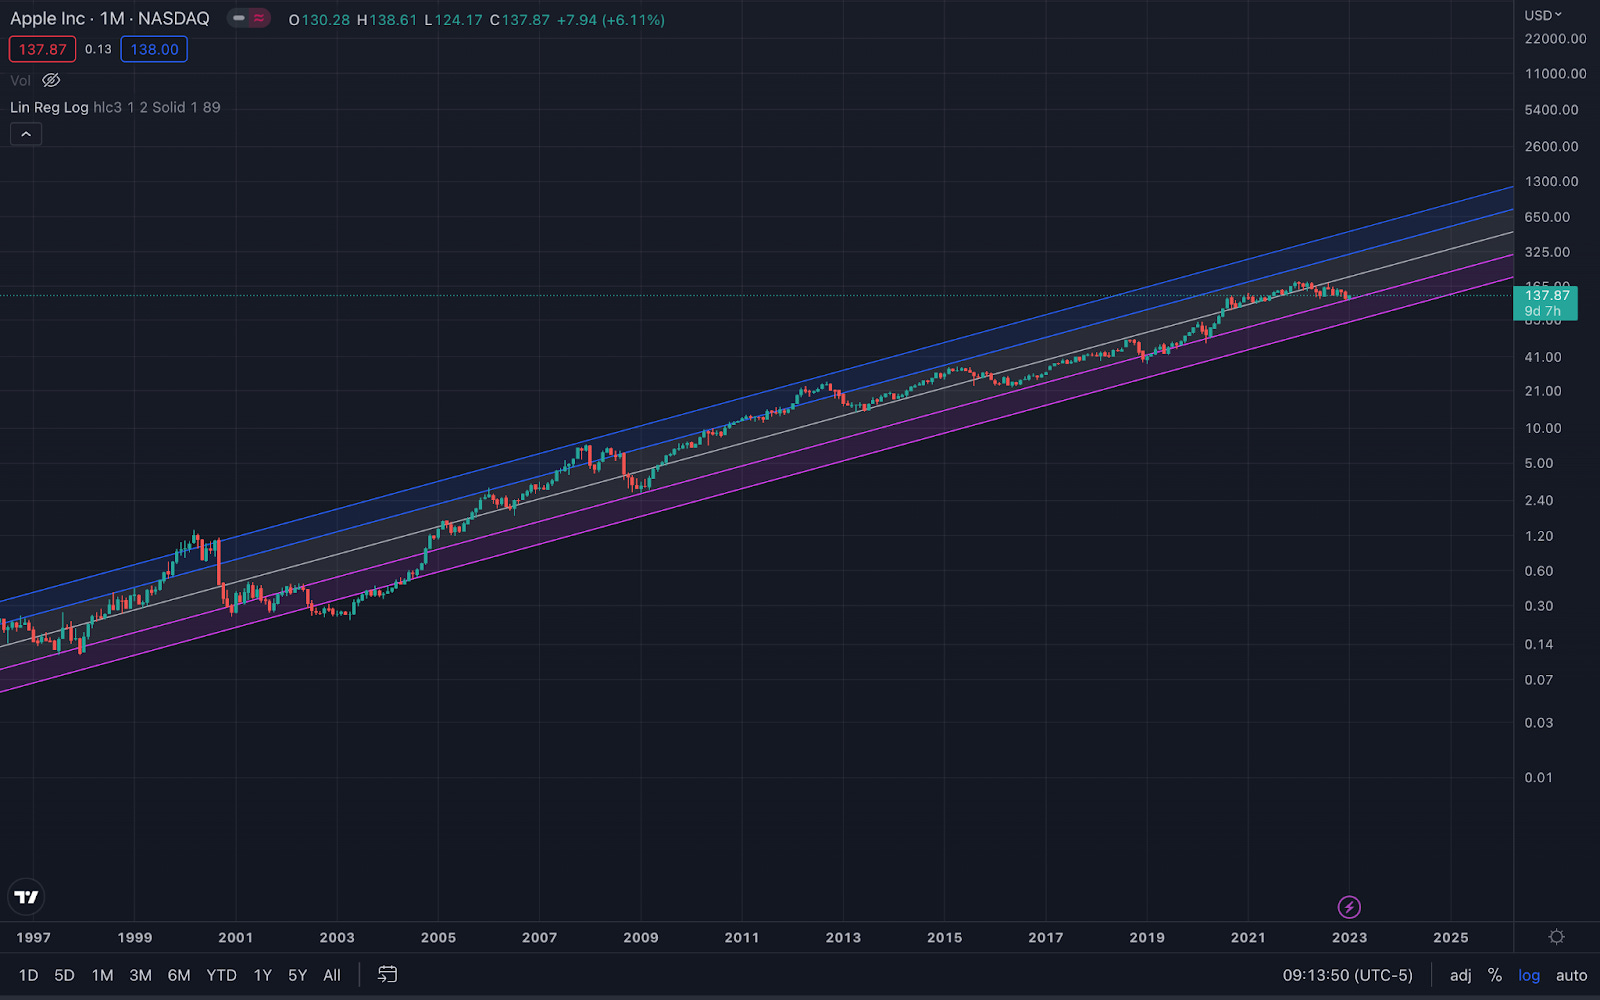
Here’s a logarithmic chart of Apple since 1997.
And here is Google (aka Alphabet Inc.).
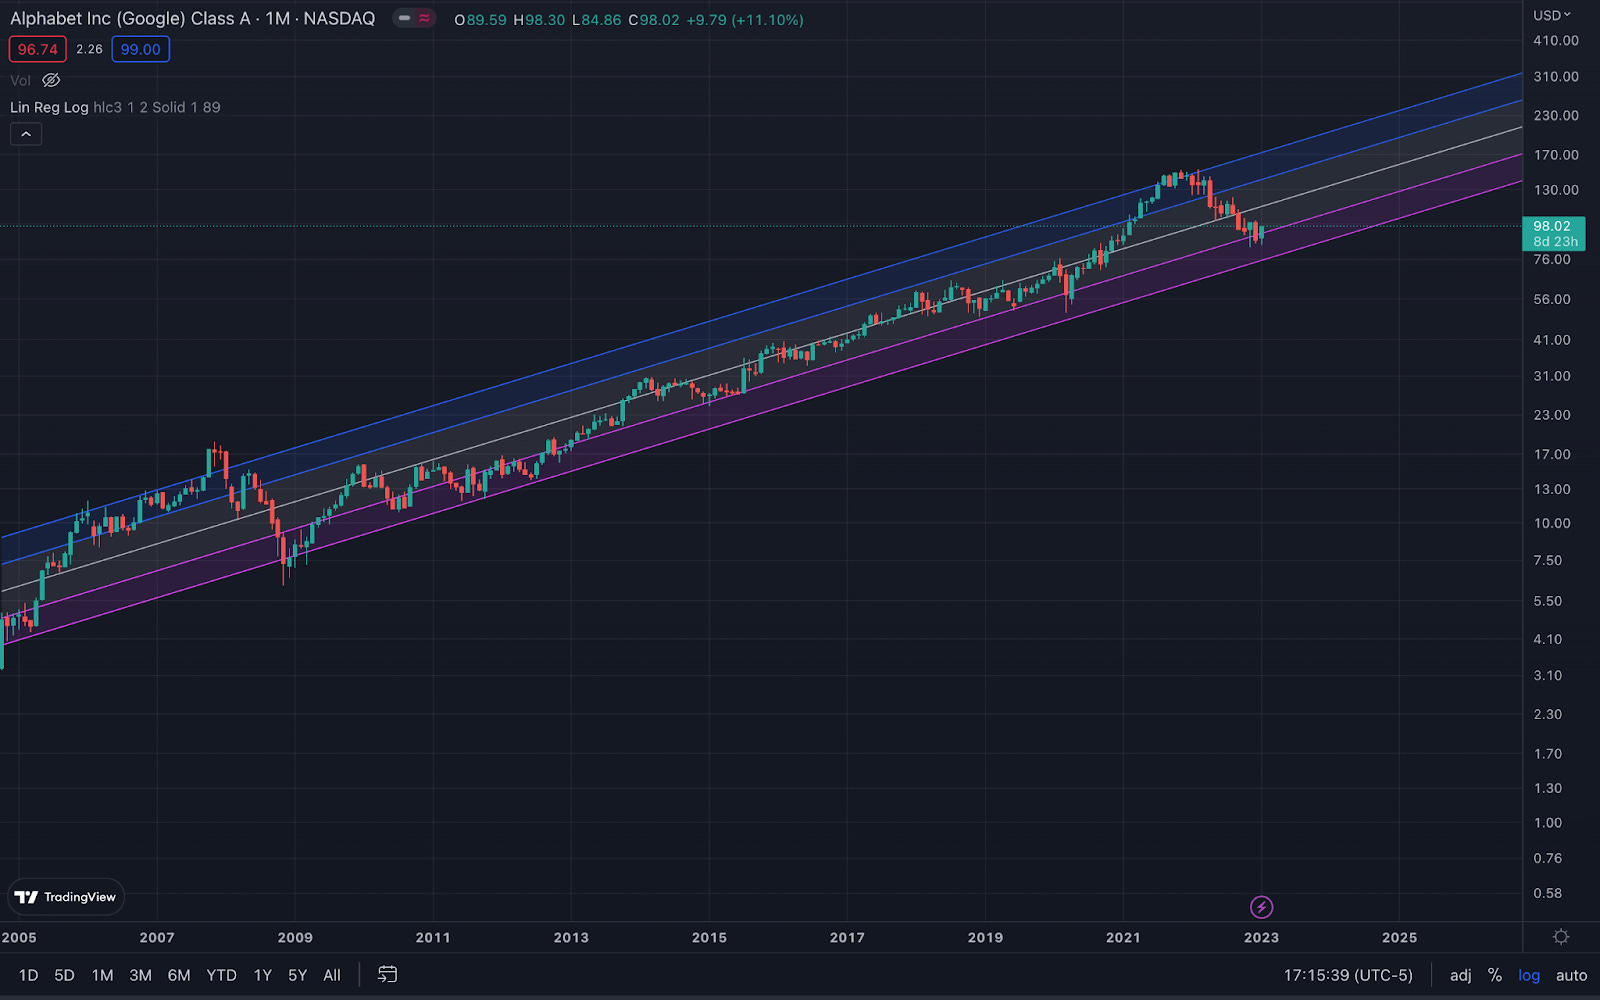
The cyclical trends can move the values above or below the trend line, however along the secular trend it typically remains within the channel of 2 standard deviations from the trend line (ie. the dark blue and purple lines at the edges).
If a network breaks, it can fall out of the channel and potentially head to 0 (ie. MySpace). Though, it can break the channel and come back too.
Here is a chart of Meta currently, which is in a critical moment in terms of the network effects of their technologies.
The adoption of Meta apps has slowed significantly and investors are betting that the network effects are broken (for now).

I showed you a chart of Bitcoin on a linear scale at the top of this report, it looks ridiculous.
Here’s what happens when you put it on a logarithmic scale.
