


Buenos Dias, DOers!
Kyle here, writing from the beautiful beaches of Nicaragua 🏖️ (FYI: Buenos Dias means GM in Spanish).
Today we’re going deeper down our journey of understanding where markets are heading.
We spent the last 2 weeks learning about the markets from the macro perspective and today we will look at the markets from the onchain perspective. 🔗

Looking onchain doesn’t just enable us to uncover key insights about business, blockchains, and protocols - we can also learn plenty about market dynamics.
How? 🤔
By understanding things like where coins are moving, who is moving them and so much more. The metrics we are about to show in this PRO report are one of the coolest things about moving financial markets onchain as none of this is possible in the traditional financial world.
Once again, by looking onchain you can understand things that others simply do not.
Now, I’ll warn you, some of the terms we will use may sound a bit foreign to you. Words like: HODL waves and adjusted SOPR. 📚 But don’t worry, as usual, we will explain them clearly and simply for you. 😊
Finally, you’ll notice we mainly look at metrics surrounding Bitcoin. We do this because Bitcoin is still the dominant coin in crypto as it has the largest marketcap, volumes, and holder base, so it gives us the best overall understanding of the market direction. 🚀
To help us on our journey of understanding markets by looking onchain, we’ve brought in Mark Helfman from the Crypto Is Easy newsletter. 💡 Mark has been looking onchain well before it was cool to do so, so he knows a thing or two about this!
At the top of the newsletter, you’ll find a video of Mark explaining each chart, it’s definitely worth a watch as he explains everything in much more detail.
Otherwise, scroll down and read the report below for a quick and simplified version. 😉
Enjoy!
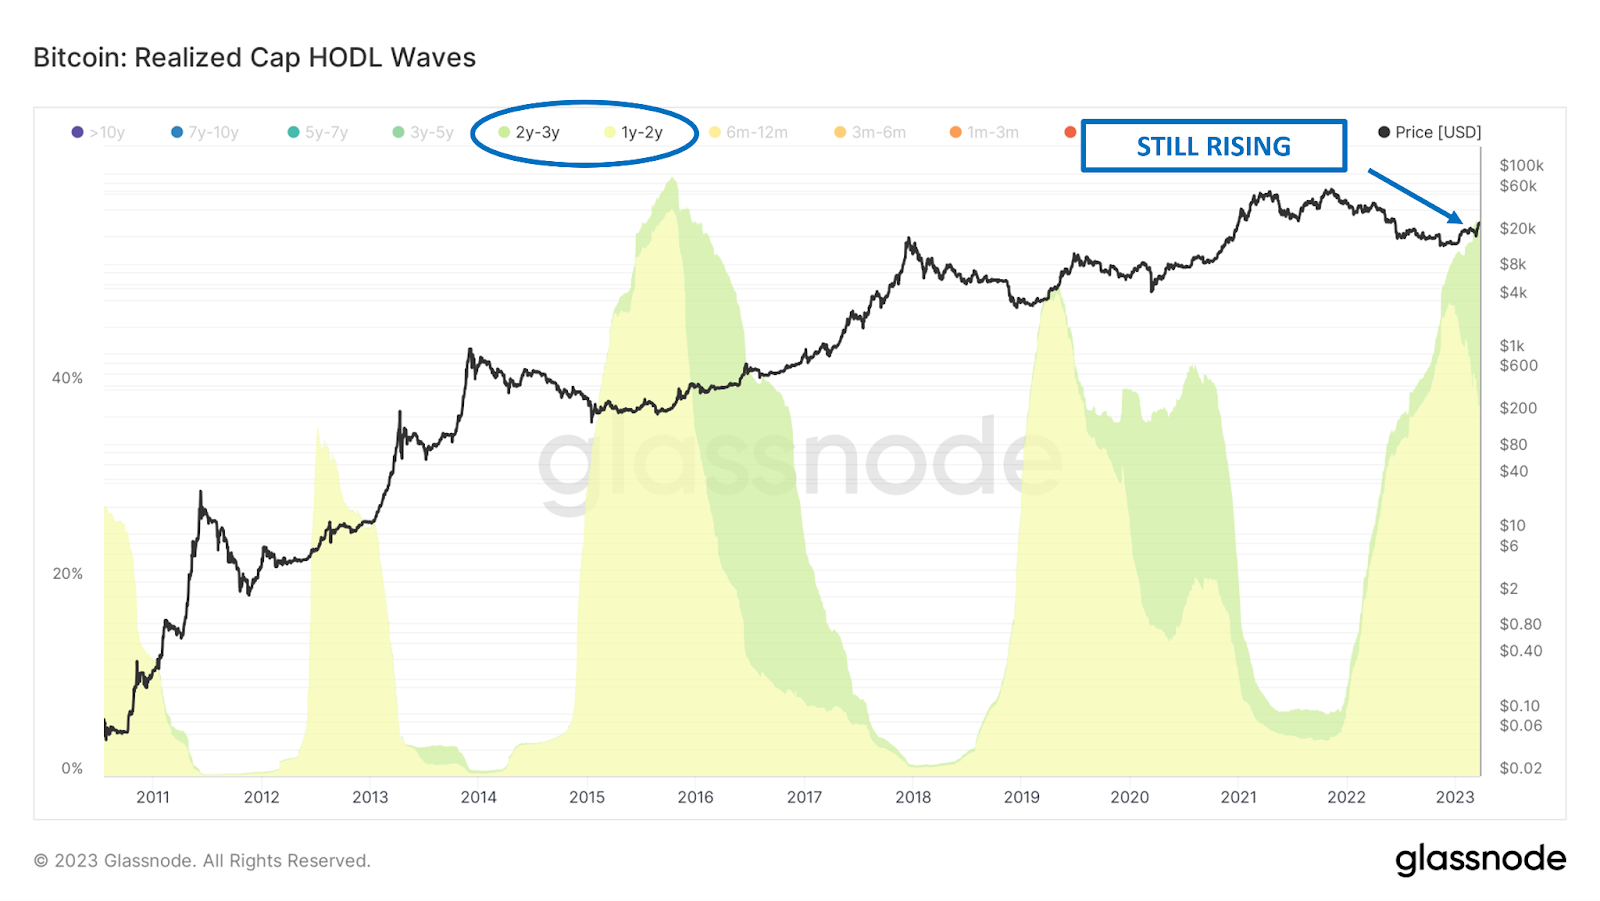
Bitcoin Realized Cap HODL Waves (1y - 3y Holders)
Hi, everyone! Mark here, happy to be sharing some of the onchain insights with y’all. 😊 Let’s jump right in, shall we?
Let’s start by discussing an interesting onchain metric called Bitcoin Realized Cap HODL Waves. 🌊
This metric shows the movement of Bitcoin over time, in different groups of people, based on how long they have gone without moving their Bitcoins.
The metric is weighted by the value of that Bitcoin in terms of market cap, which allows us to see the influence these different bands have on price and momentum.
What we've observed recently is unprecedented growth in the one to three-year holders, despite the price going up 70-80% from the bottom. Not only are they still holding, but they are also growing as a proportion of the market cap.
This bodes well for the durability of the current price move, as long-term holders with a lower cost basis are not selling, and there's not even a hint yet that these people are starting to take profits. 💪
You can see in the chart above that when this same thing happened back in 2019, 2015, and 2012 the following years did really really well in terms of the price of Bitcoin.
Of course, we can’t rely only on one metric to tell us the direction of the market, so let’s continue on…
